
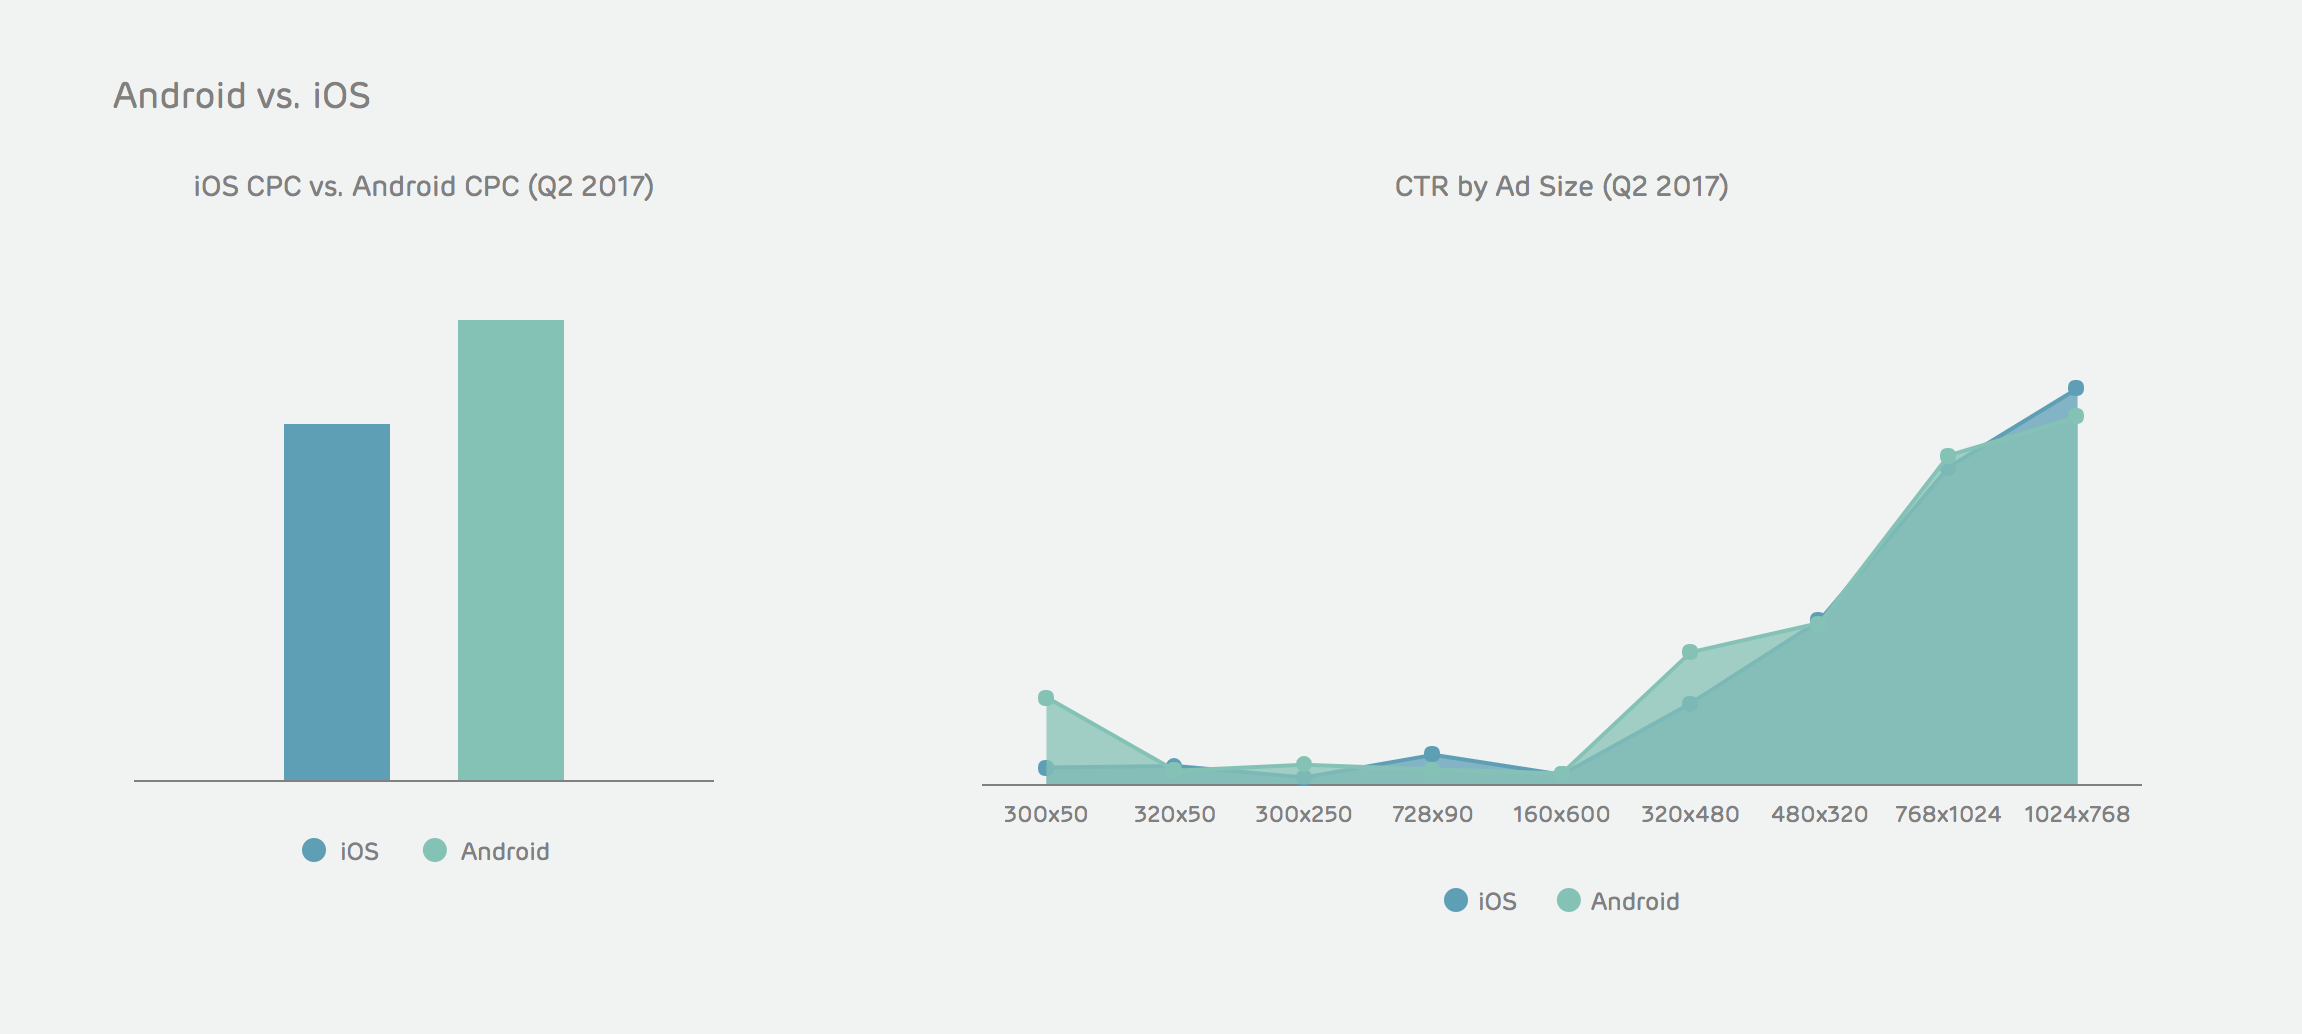
I developed a few pieces of key collateral that were used by most teams at Drawbridge. This included; spec sheets to be provided to clients, power point templates for sales teams, rich media templates, and lastly, an interactive microsite housing our benchmark data that was updated quarterly. These benchmarks contained data for not only CTR by things like ad size and device type, but also included data by vertical, operating system, household income, and gender.
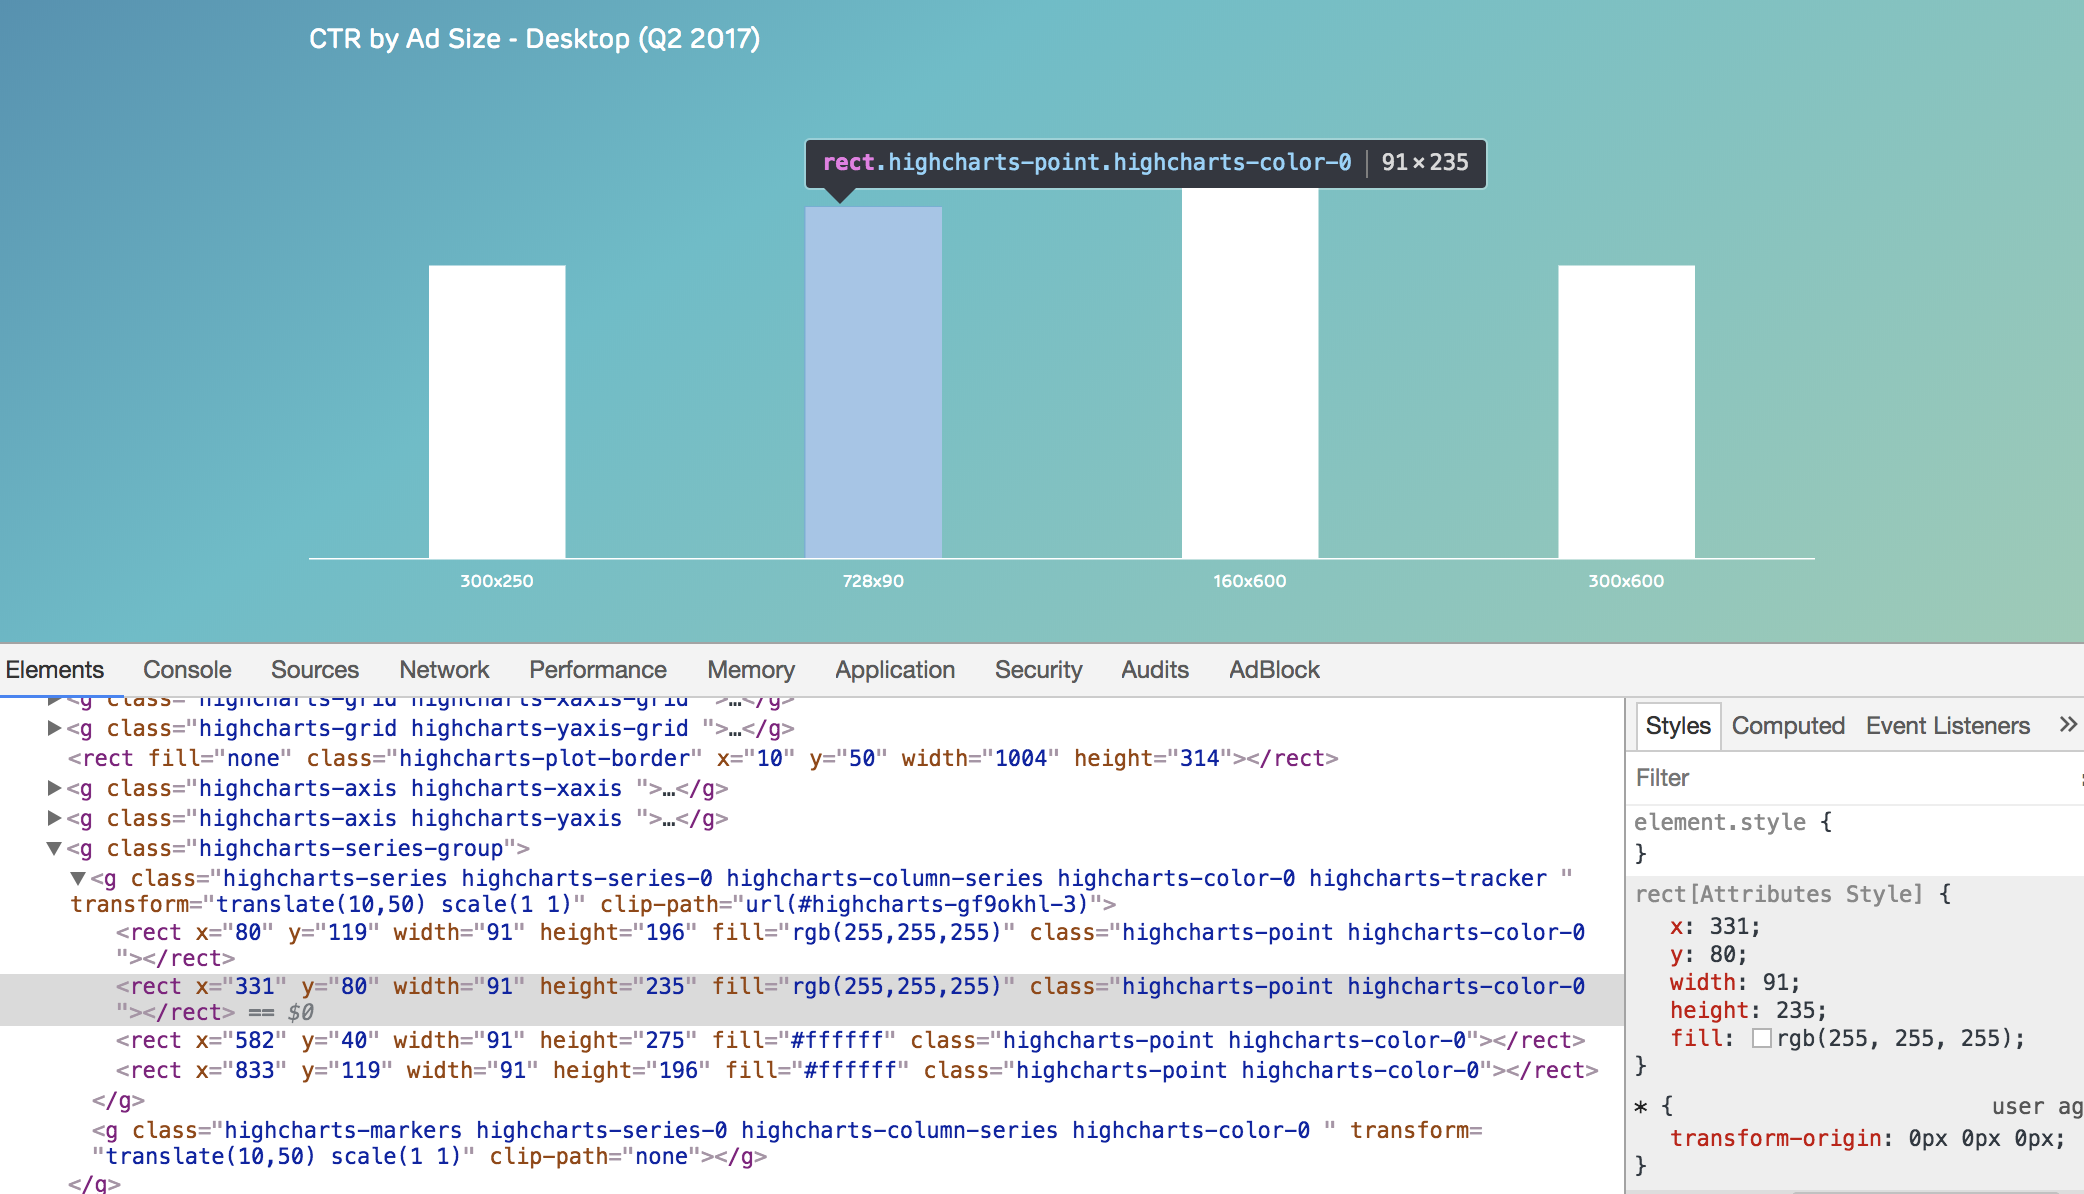
The benchmarks data was pulled into excel where my team pivoted and sorted the data. Next all the data was laid out to be coded and formatted to utilize the Highcharts interactive JavaScript library.
Our benchmark data was used by sales and sales planning teams, as well as ad operations, campaign management, and account management teams.

We additionally built out metrics and benchmarks for our custom rich media units that had their own reporting. Because every rich media unit is unique, we found it important to have unique and custom data for each template. This allowed for seamless conversations for the client and sales team, and helped all parties to have accurate expectations.
AB Testing Machine Zone