
When an ad is completed and trafficked, my role doesn't end. I monitor performance of the ad as it is live, allowing me to instantly know if an ad is functioning correctly or not. I then provided detailed reporting data to our clients. I learned how to not only proficiently use the Drawbridge reporting suite, but also to use a variety of other reporting and analytics tools such as Metamarkets and MySQL. I utilized these tools to increase ad performance for our highest spending clients by more than 3x. Keep reading to understand how I helped grow Luyft performance.
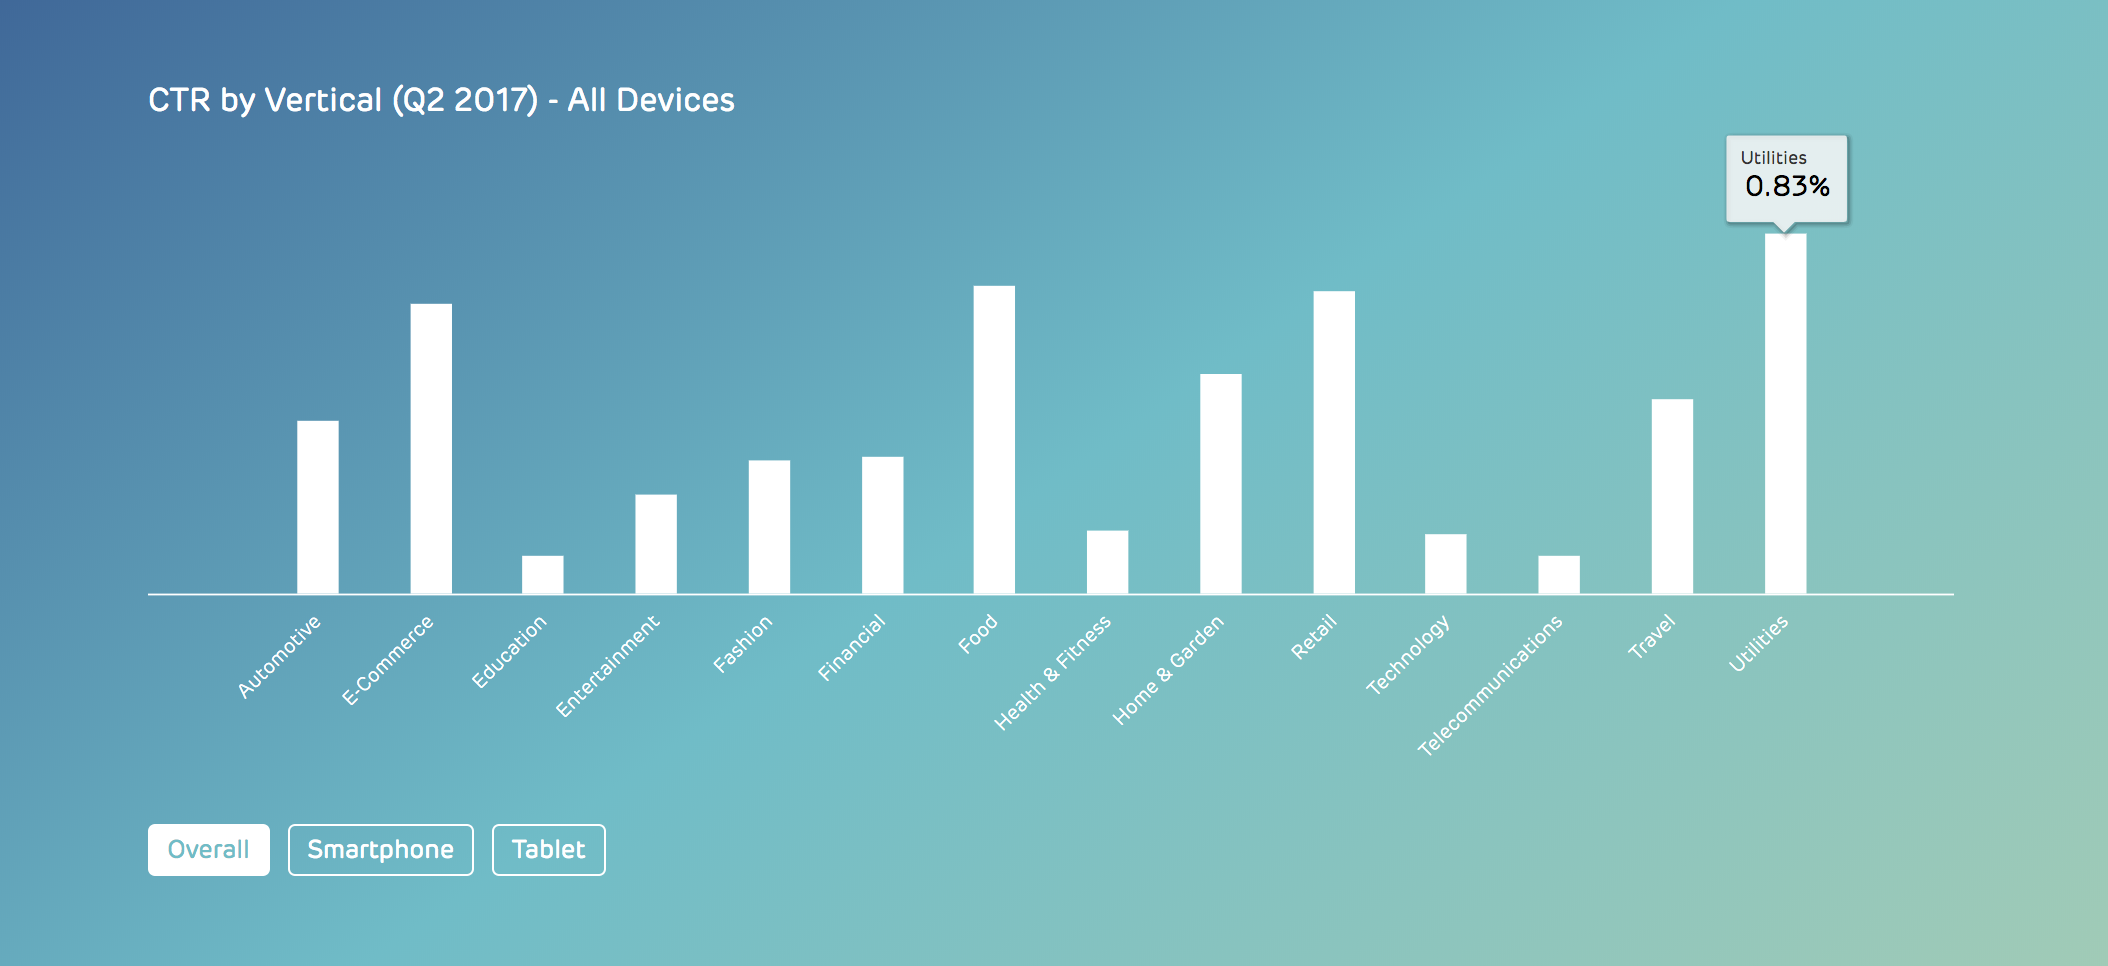
Lyft had a variety of KPI's and goals. They wanted advertisements to support both lines of their business (the drivers and the consumers). Their metric goals included our normal provided reporting (CTR, CPM, CvR), as well as multiple specific metrics to them (Installs, Cost per First Ride).


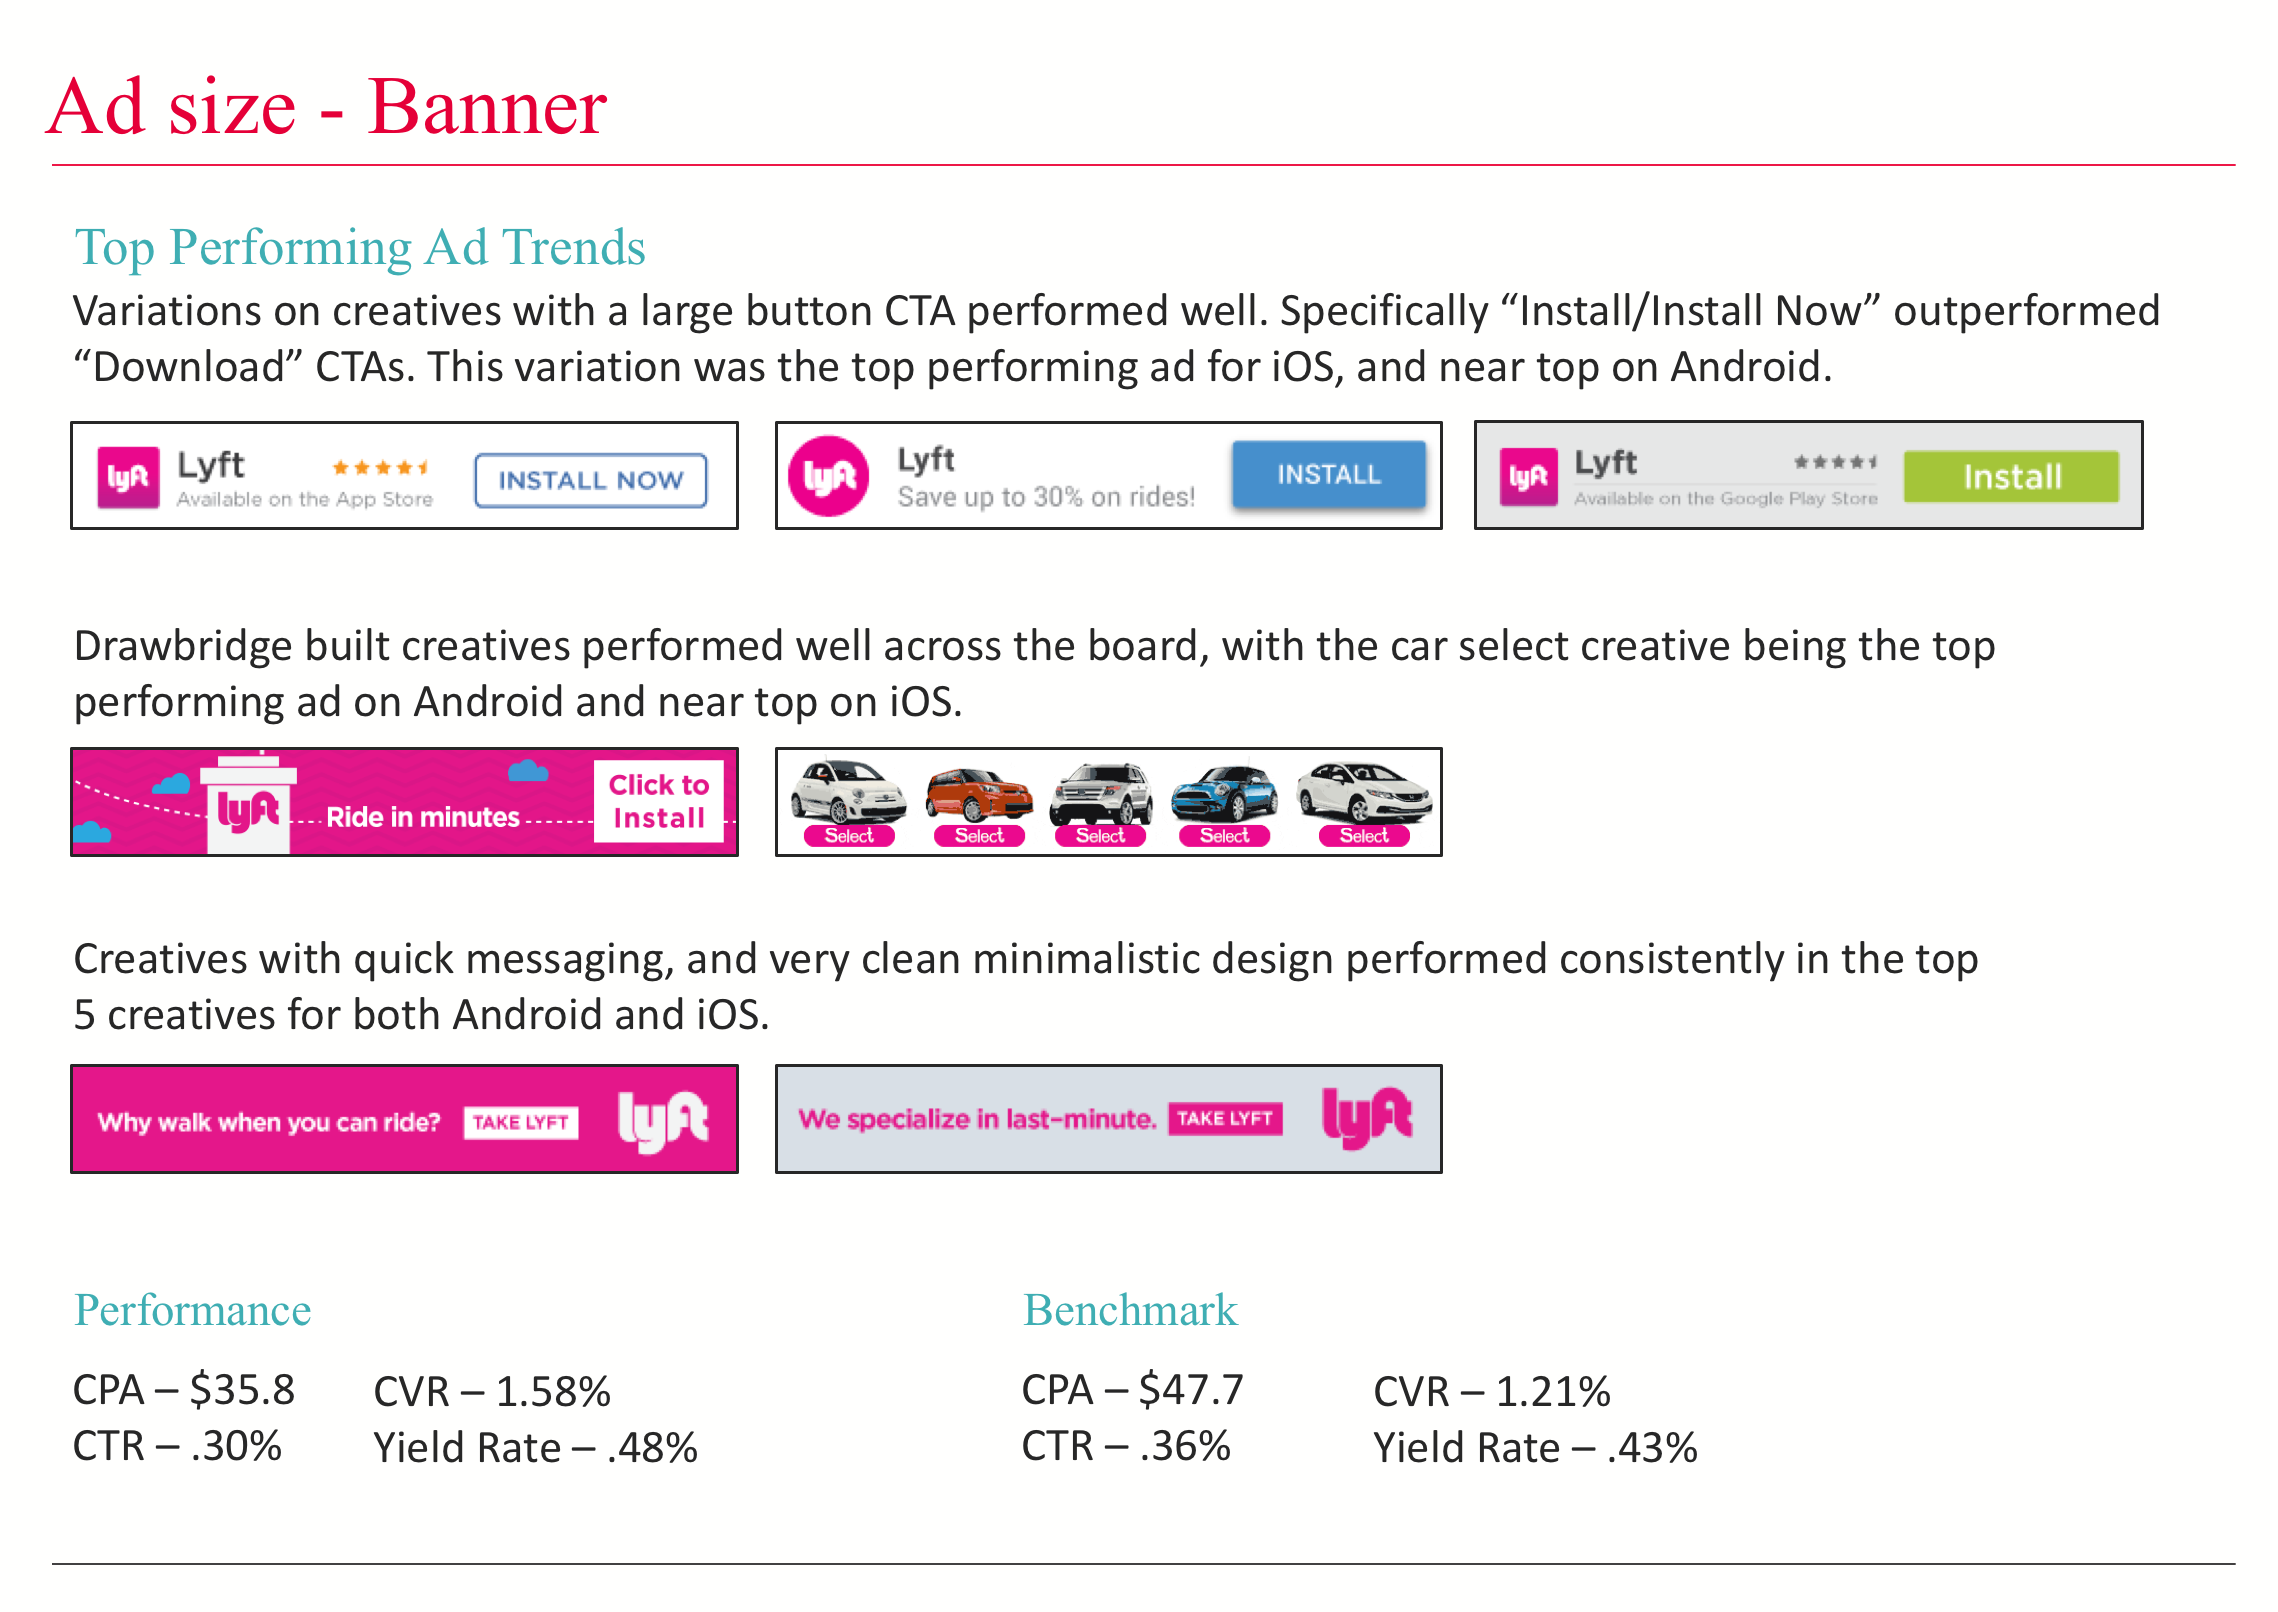
Variety of Lyft Creatives
Working closely with the Lyft team, I built and guided my team to develop a wide variety of creative executions. From high performing seasonal ads to interesting branded native ads, we constantly pushed and developed new creatives based on data we collected on live performance. I was able to increase overall CTR of the Lyft account by over 200%, and I was able to further increase CvR on interstitial mobile ads by more than 350%.
I kept track of over 100+ different ads across 9 different ad sizes, multiple devices, operating systems, and location geos. I would monitor each creative over time and prune out poorly performing creatives. To guage performance, I worked closely with the data science team to create a statistical anaylsis test to compare performance of the creative by not only their goal metrics, by also by weighing in things like impression count to ensure I was getting statistically significant results.
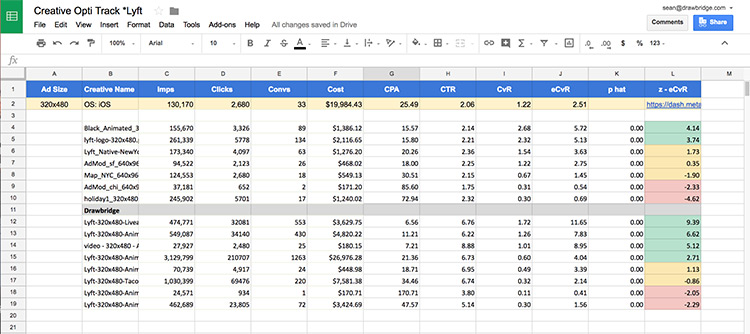
Example Lyft Report
By using these statistics tests, I was able to develop instrumental A/B tests that were some of the biggest factors towards performance lift. I would develop multiple concepts with slight variational differences. I then ran these creatives on identical campaign setups and used my analysis to turn off poor performing creatives and to improve upon the best performing units with new A/B test variations. Because of the success of this methodology, I began to apply it to numerous other high-value accounts, all with successful and similar results.
Partnerships Analytics