
After a test plan was approved via multiple sources, I worked with Ad Operations team to setup the test on our internal web tools, and then I input the creatives and budgets. I added any targeting parameters and selected correct bid selections and models for our media buying.
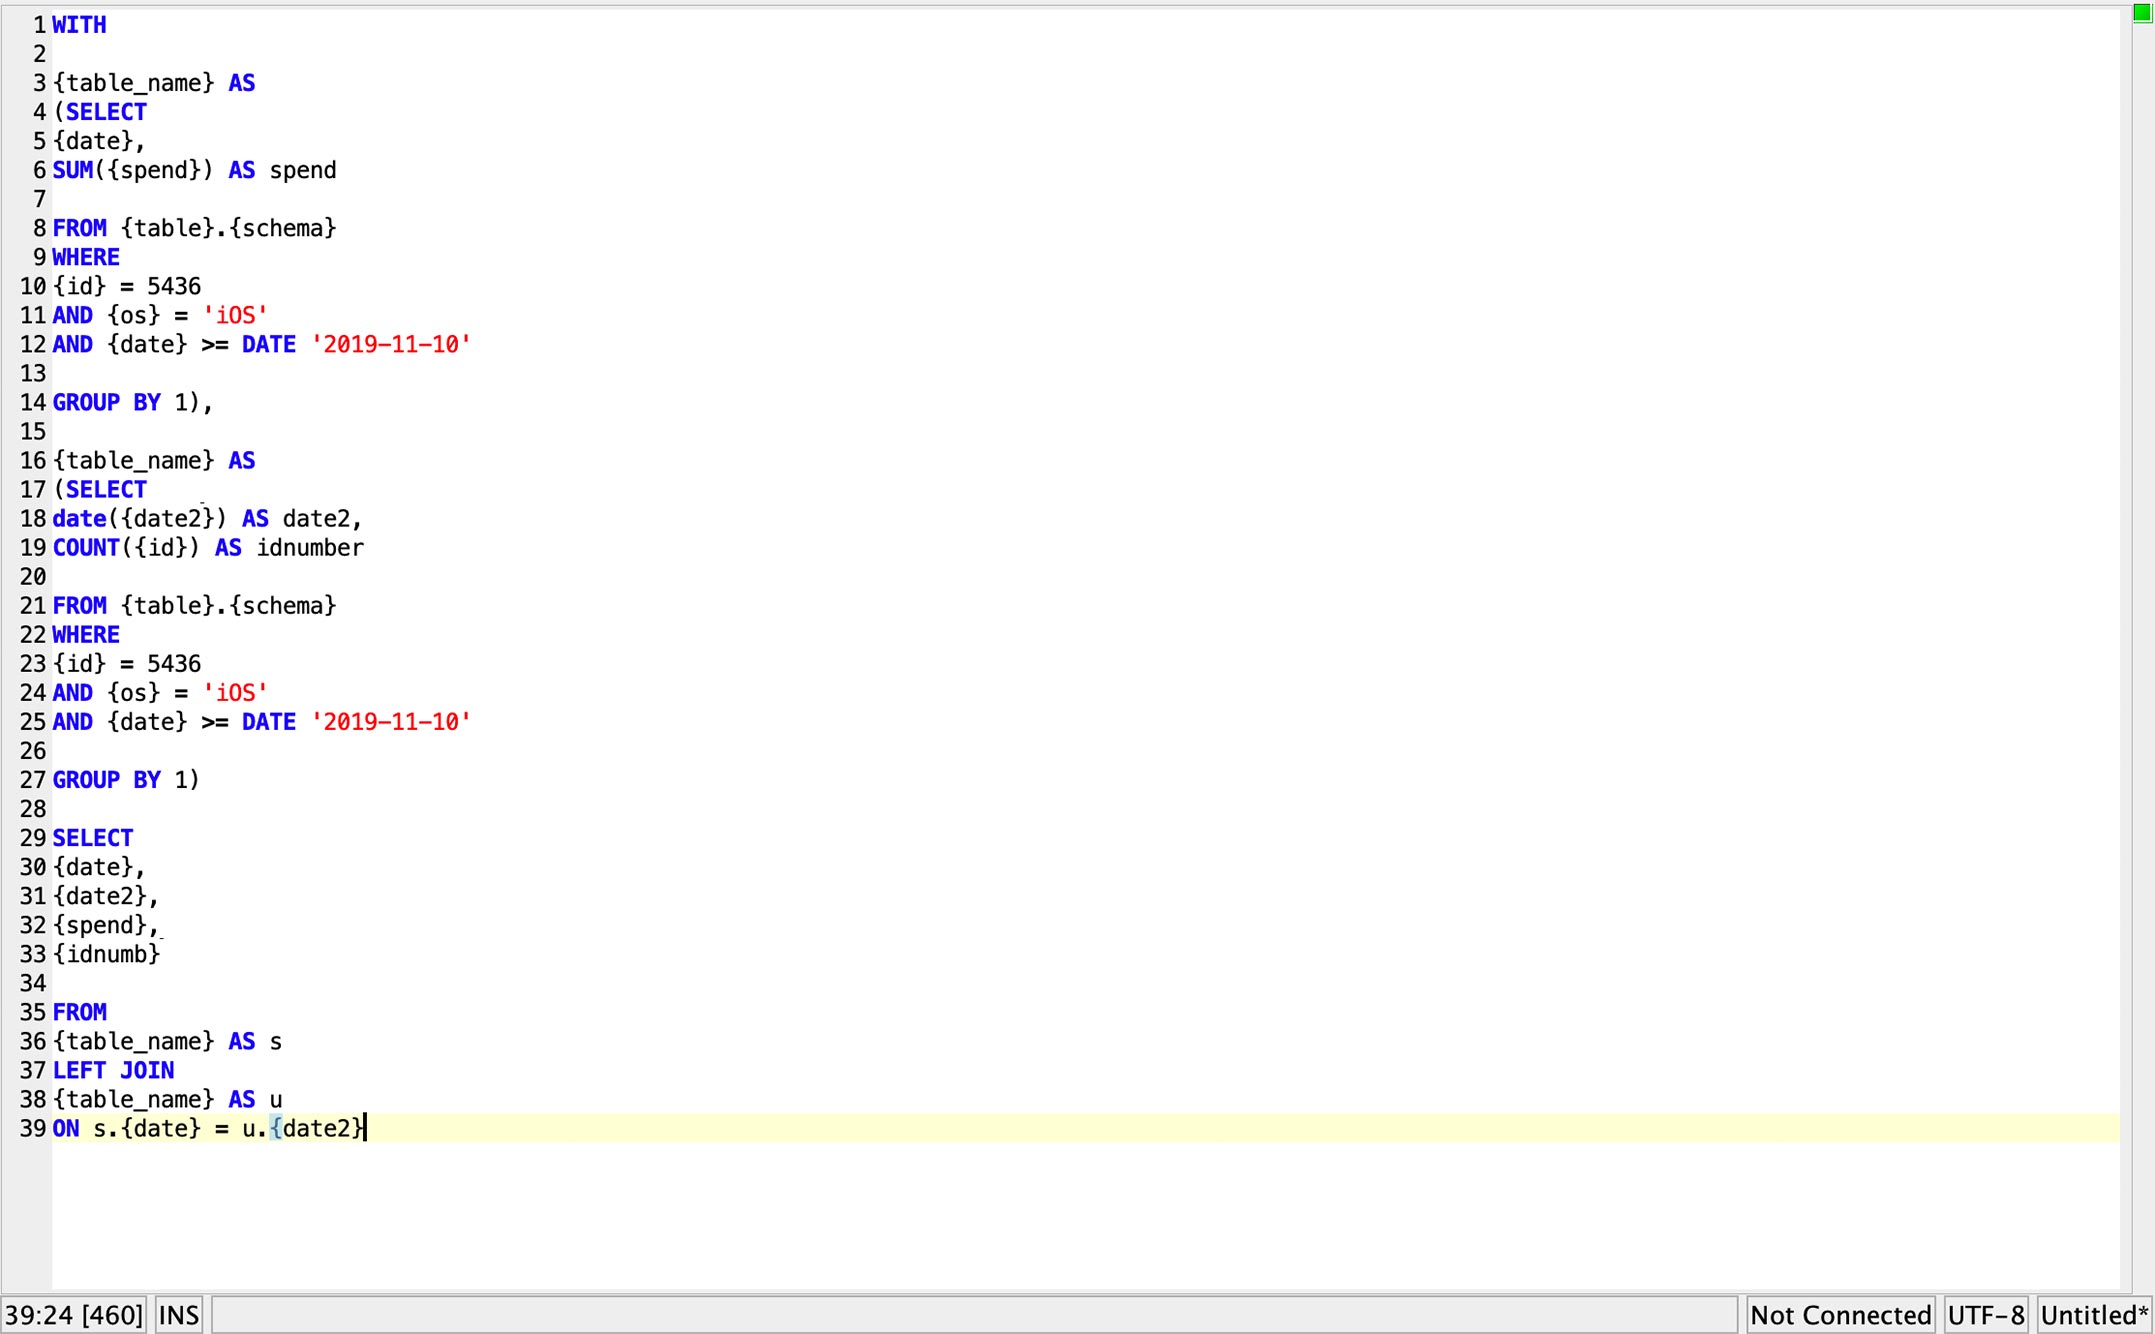
A Simple Example of a SQL 'Left Join' Across Multiple Databases
Database Queries - DBVisualizer / SQL / Presto / HIVE / Vertica
Using SQL code, I pulled reports from our database that I then processed and compiled into trends that the company could use to take actions on future testing and content builds.
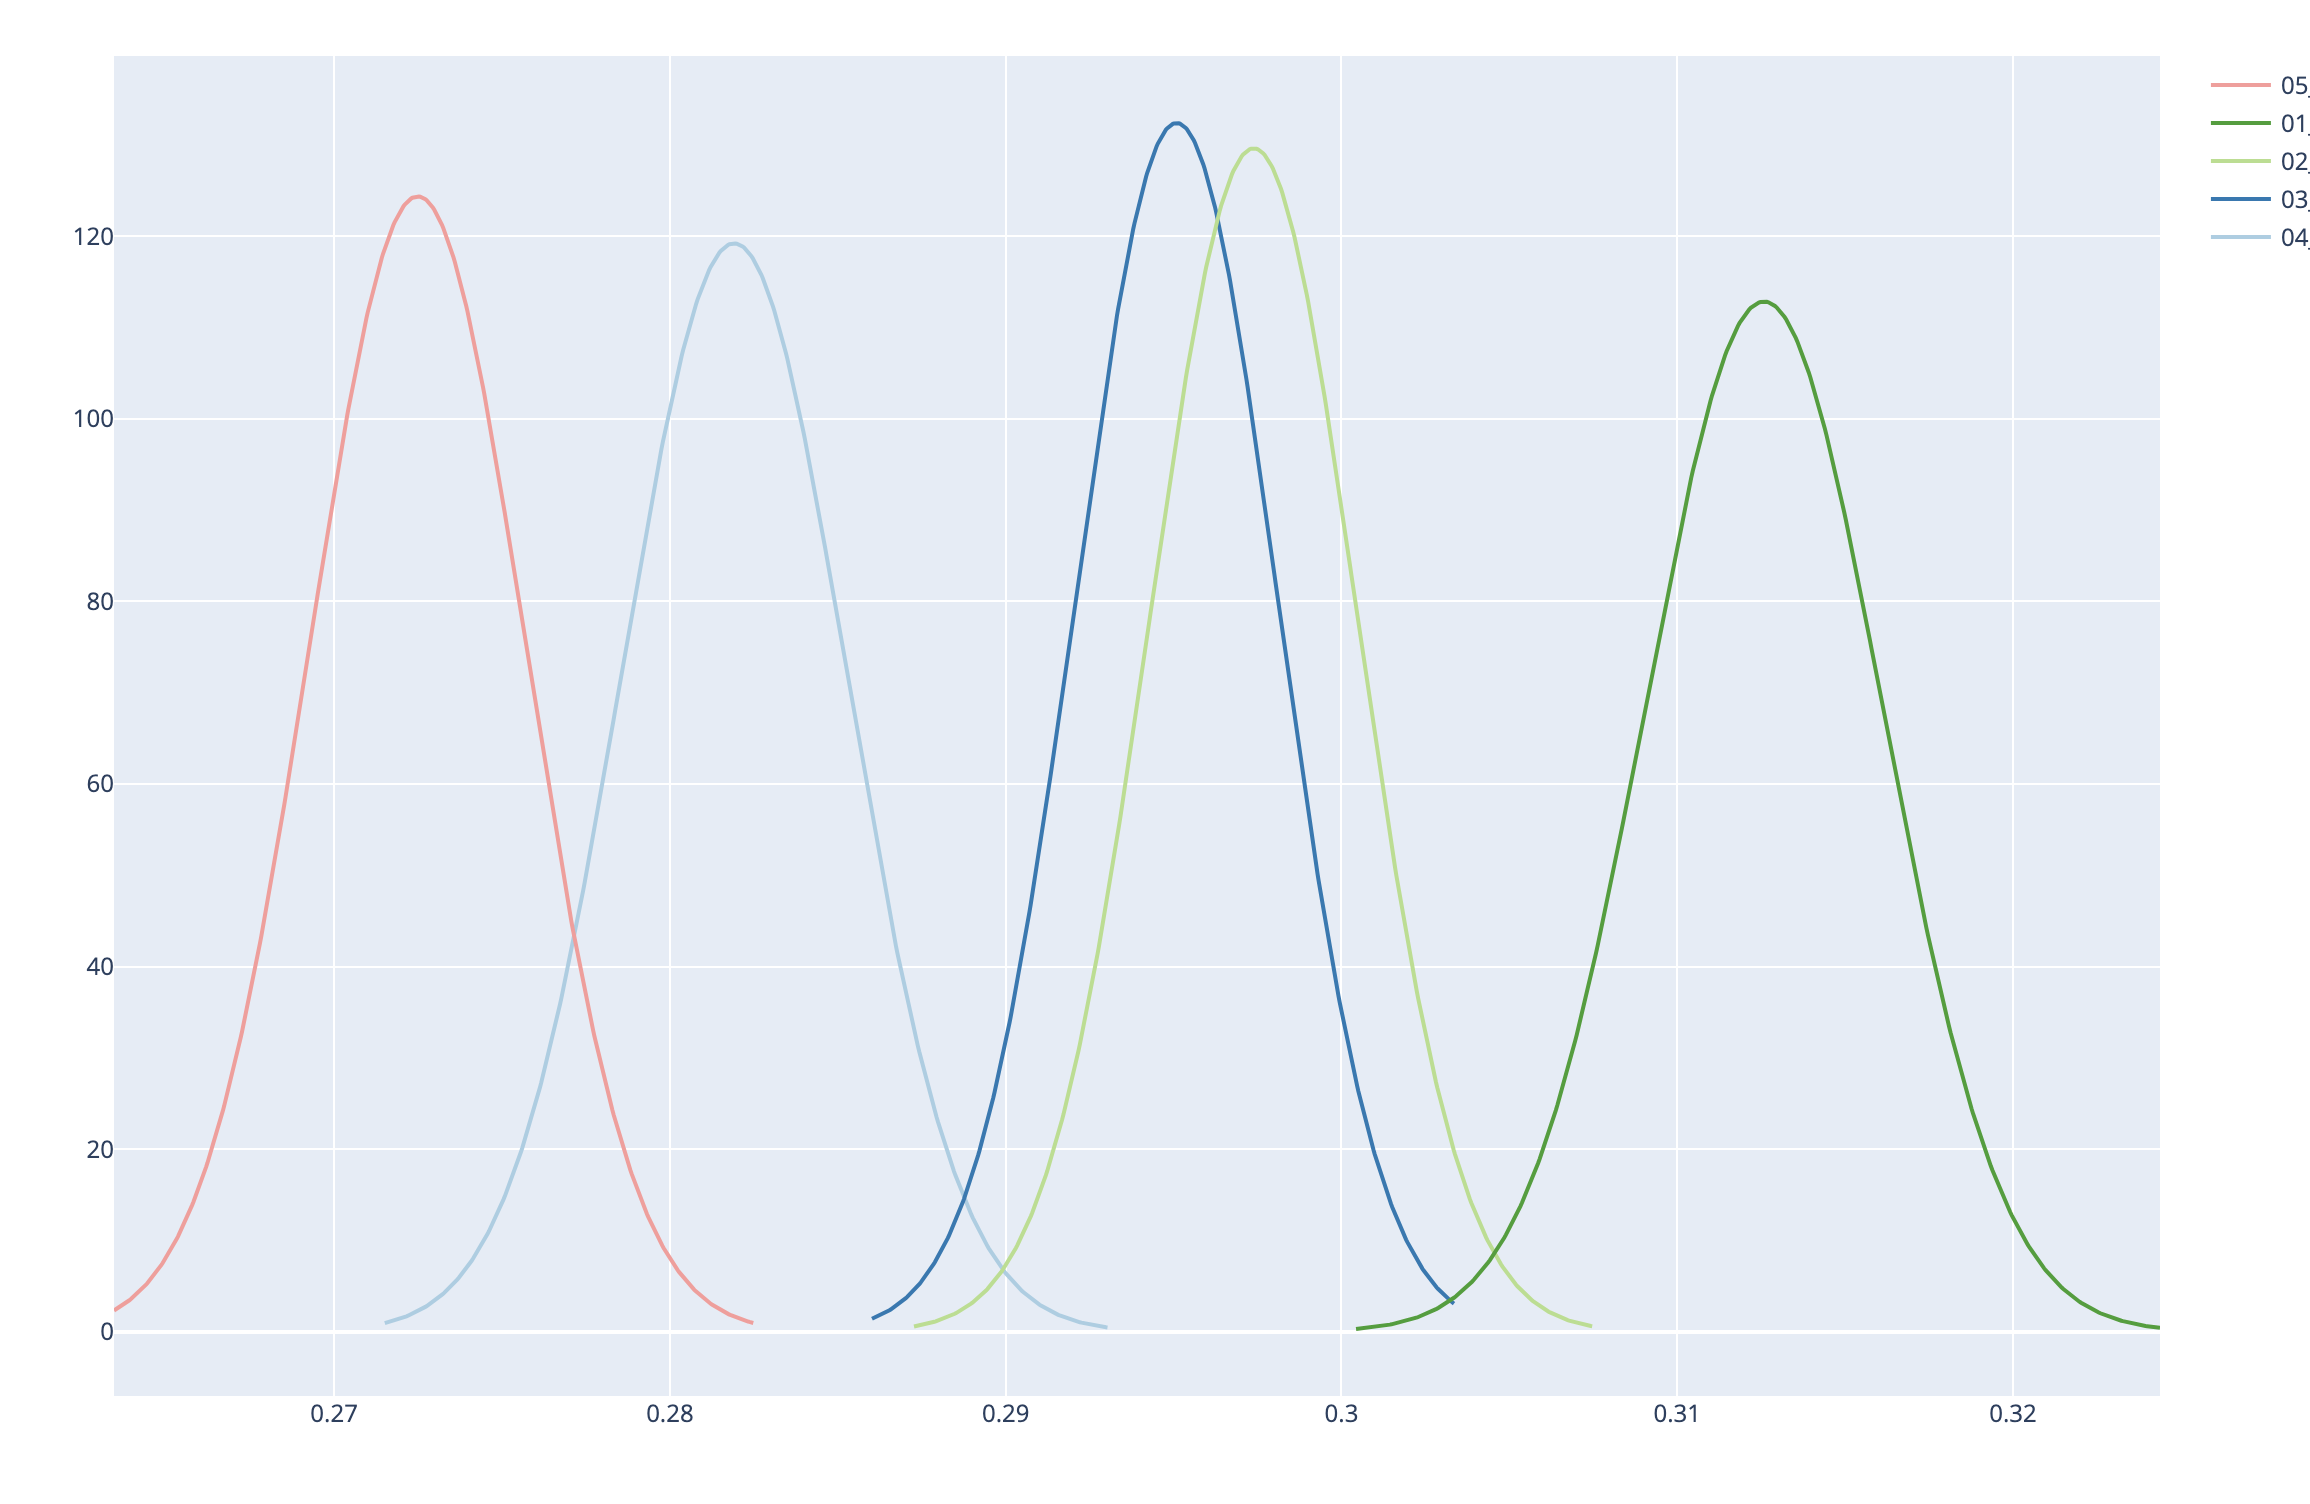
Graph Plotting for Ranking Analysis
Once I pulled the reports, I used excel functions to pivot the data in useable bites, before finally running the results through statistical testing and plotted the results via bell curves using standard deviations. Each curve represents the possible CTR of a specific creative up to 3 standard deviations from the mean CTR in our results.
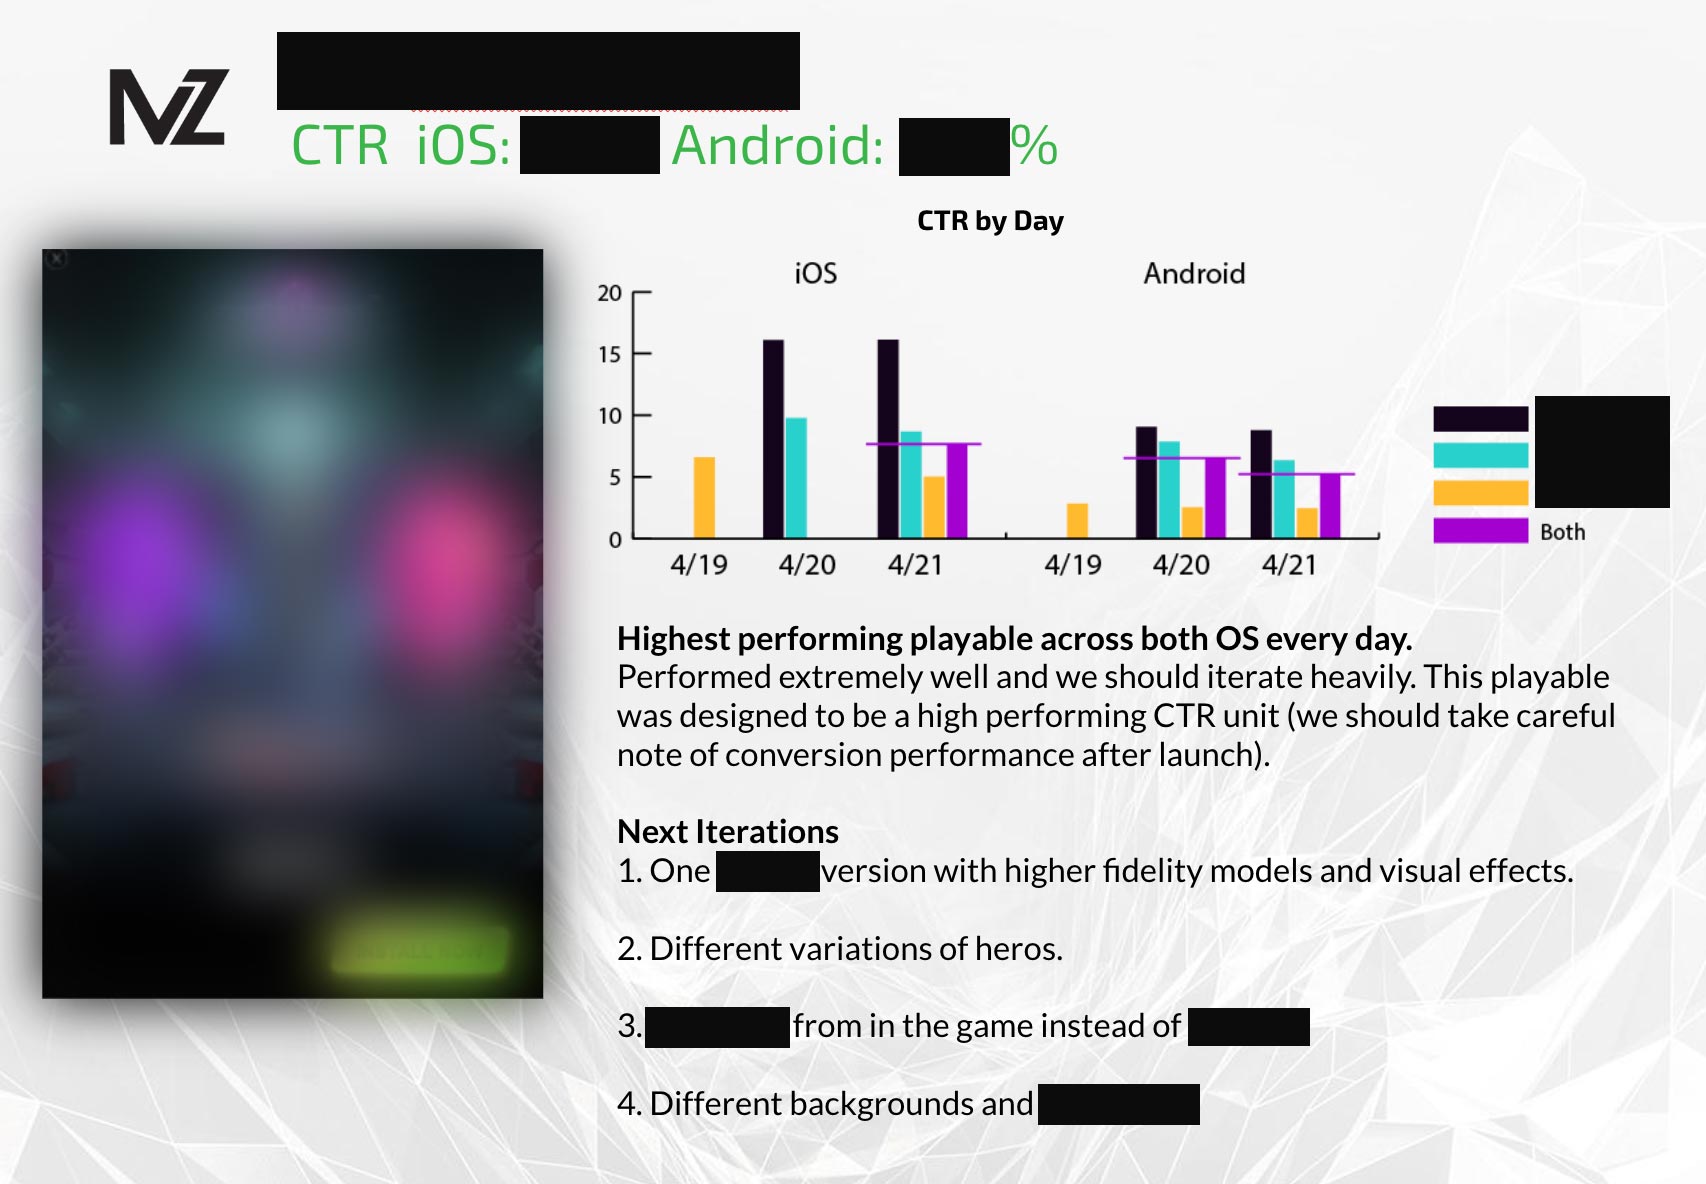
CTR Over Time Comparing Operating Systems
By comparing our data in apples-to-apples conditions, I am able to find trends and directions for our team to take. This includes finding unique wins that would otherwise be missed in rolled up data reports.
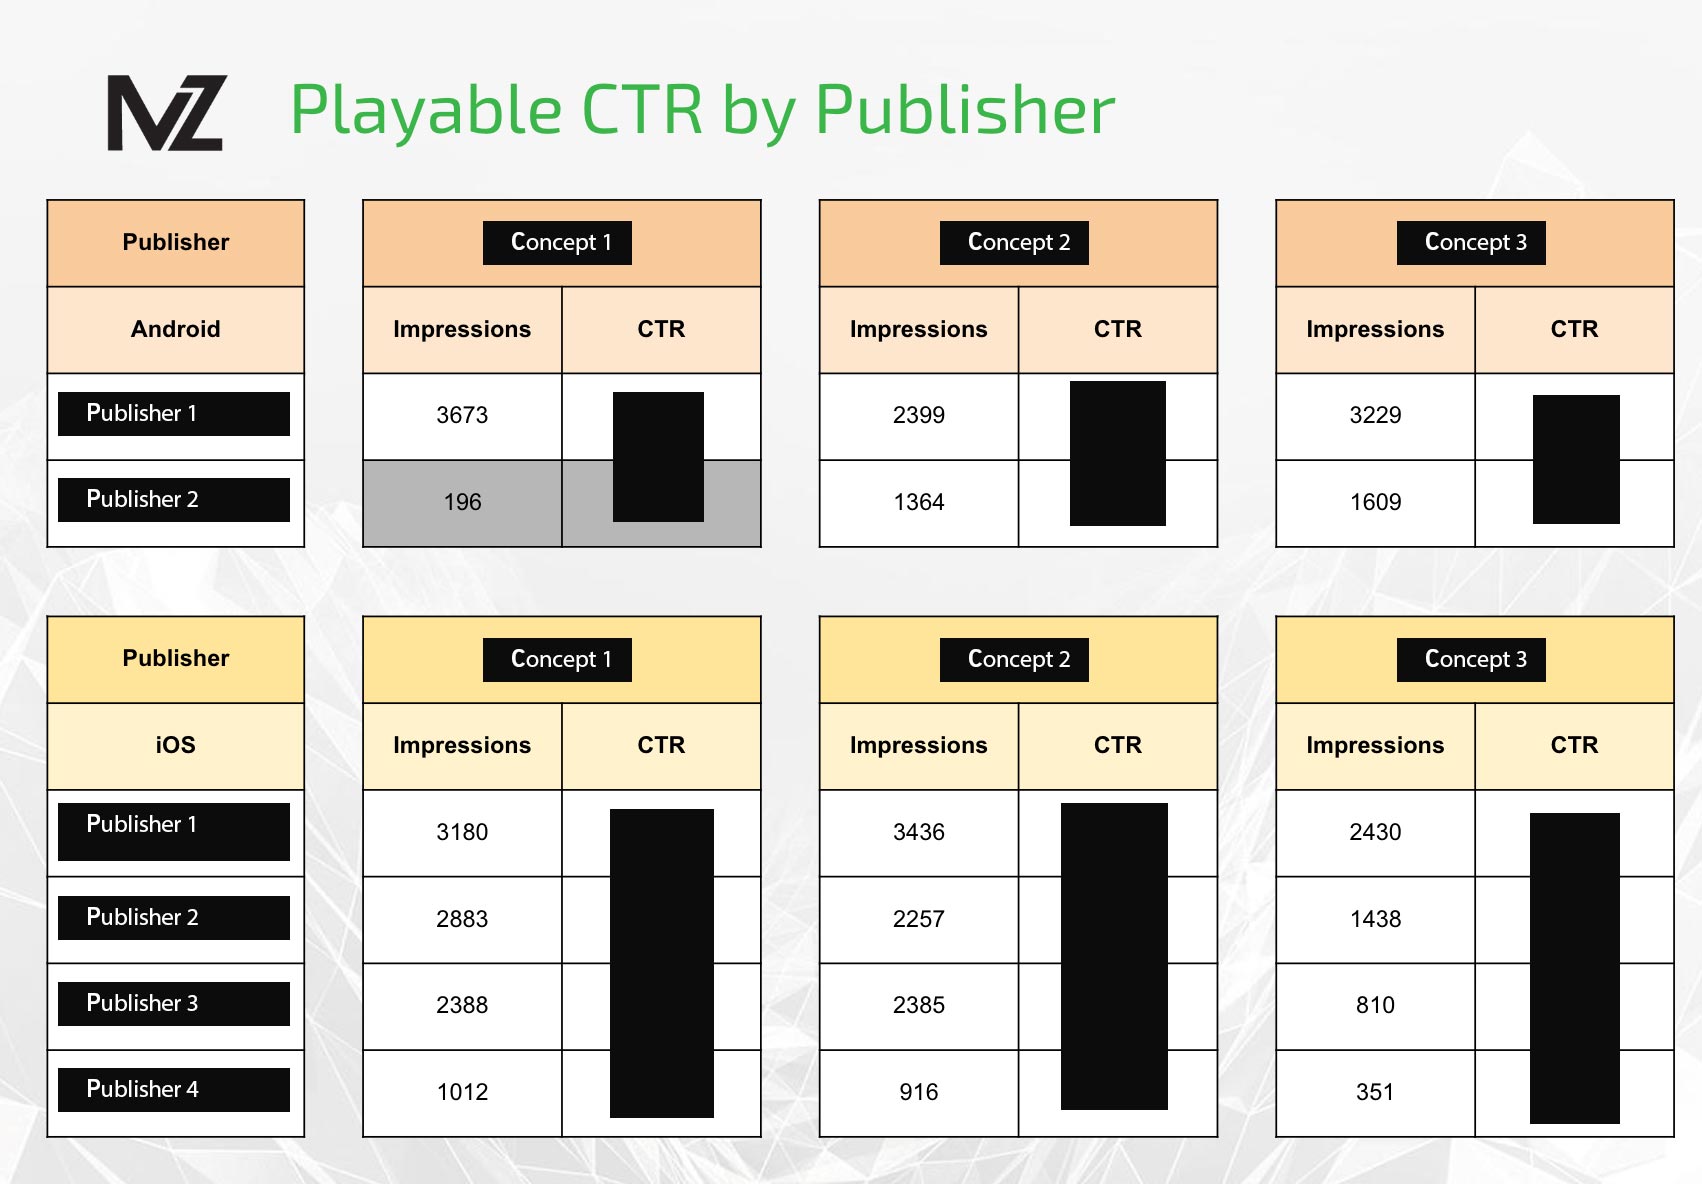
Publisher Analysis Across Operating Systems
I am able to utilize our data insights to direct our media spend to the highest return on investment publishers, and to detect fraud across operating systems, geos, and exchanges.
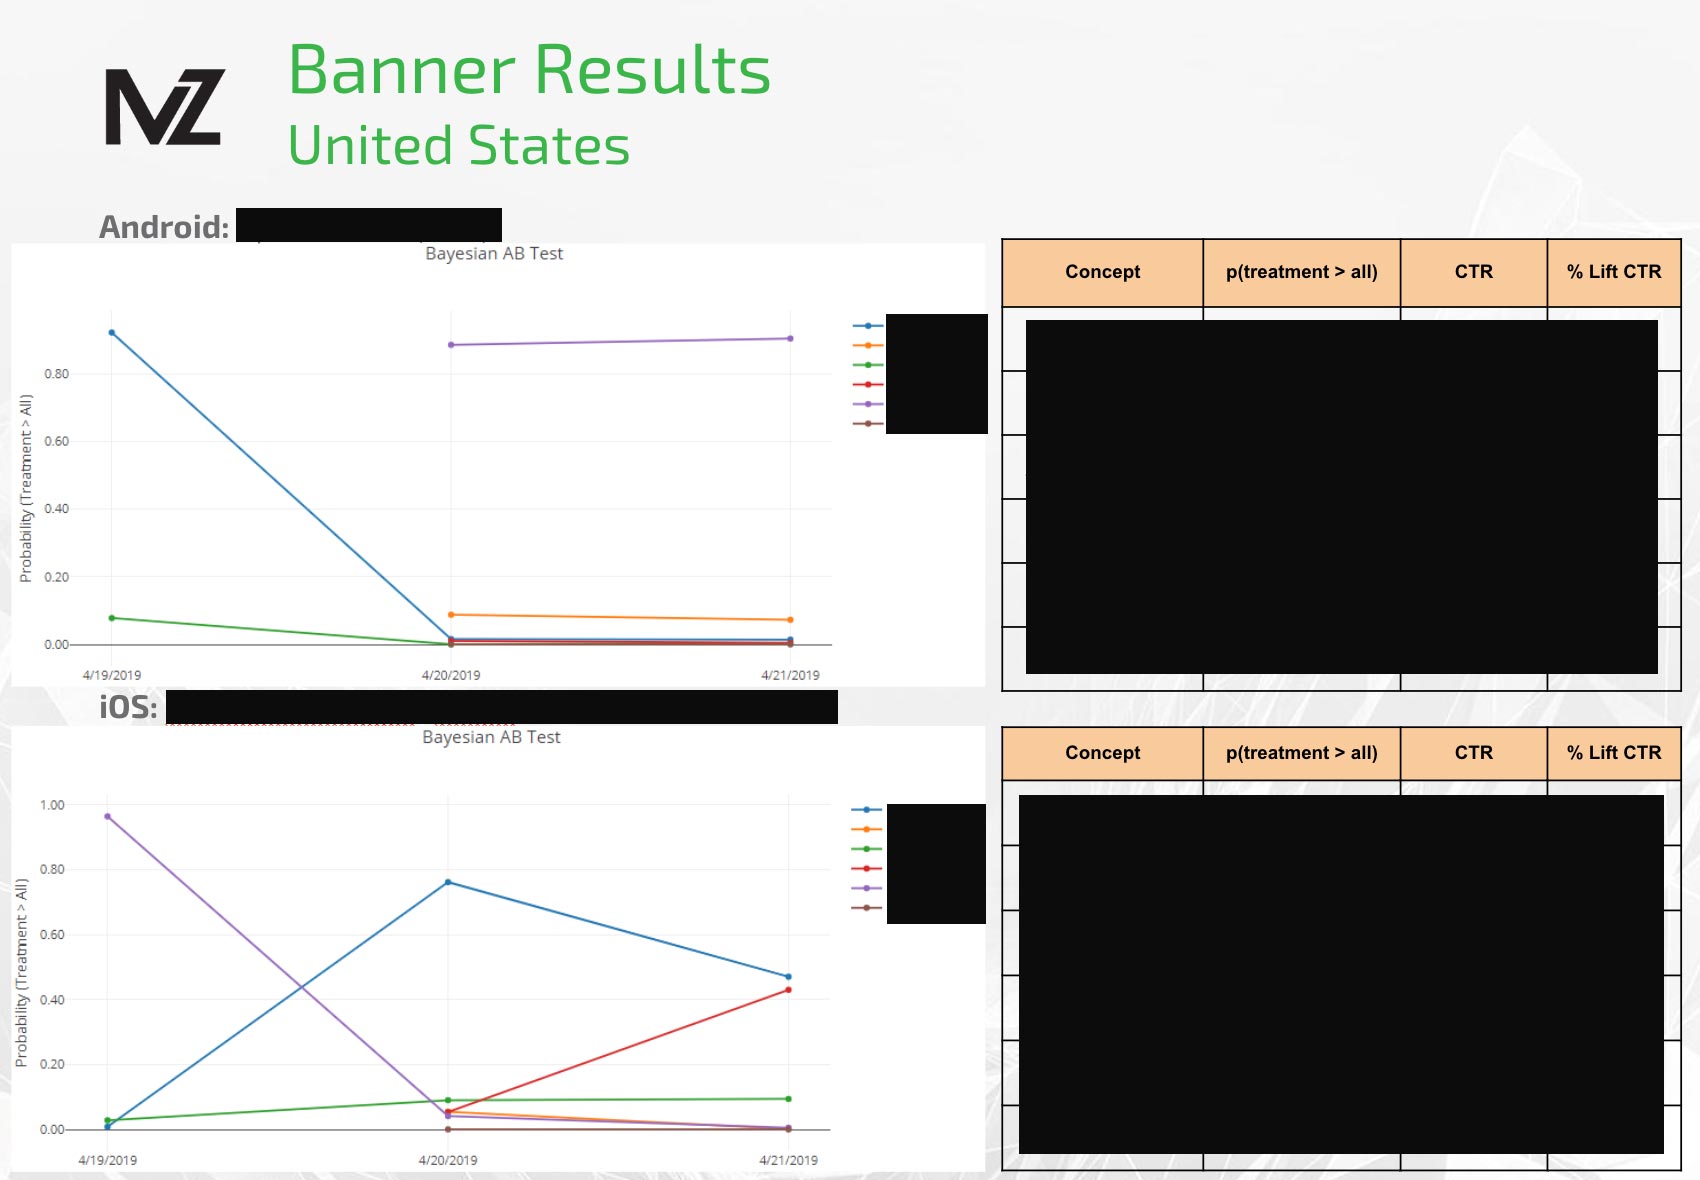
Chi-Squared Testing
Using popular methodologies like Chi-Squared and Bayesian Analysis, I can plot performance and direct our team to the statistically significant results over wasting ad spend on under performing creatives.
Operations Microsite